Examples 1
Here are some examples to demonstrate how to use the HYPEHD package. The test datasets are open source data from https://github.com/insightsengineering/scda.2022 website.
%%capture
%pip install --index-url https://test.pypi.org/simple/ --extra-index-url https://pypi.org/simple hypehd
Imports
import hypehd
from hypehd import visualization as vis
from hypehd import data_manipulation as da
Read test data
dm is a dataset including a set of essential standard variables (age, sex, race…) that describe each subject. vs is a longitudinal dataset including a set of vital signs records per each patient, each visit.
# read into dataframe dm from package
my_file = hypehd.PACKAGEDIR / 'data' / 'demographic.csv'
dm=da.read("csv", my_file)
dm.head()
| Unnamed: 0 | STUDYID | USUBJID | SUBJID | SITEID | AGE | AGEU | SEX | RACE | ETHNIC | ... | DCSREAS | DTHDT | DTHCAUS | DTHCAT | LDDTHELD | LDDTHGR1 | LSTALVDT | DTHADY | ADTHAUT | study_duration_secs | |
|---|---|---|---|---|---|---|---|---|---|---|---|---|---|---|---|---|---|---|---|---|---|
| 0 | 1 | AB12345 | AB12345-CHN-3-id-128 | id-128 | CHN-3 | 32 | YEARS | M | ASIAN | HISPANIC OR LATINO | ... | DEATH | 2022-03-06 | ADVERSE EVENT | ADVERSE EVENT | 22.0 | <=30 | 2022-03-06 | 1106.0 | Yes | 63113904 |
| 1 | 2 | AB12345 | AB12345-CHN-15-id-262 | id-262 | CHN-15 | 35 | YEARS | M | BLACK OR AFRICAN AMERICAN | NOT HISPANIC OR LATINO | ... | NaN | NaN | NaN | NaN | NaN | NaN | 2022-03-17 | NaN | NaN | 63113904 |
| 2 | 3 | AB12345 | AB12345-RUS-3-id-378 | id-378 | RUS-3 | 30 | YEARS | F | ASIAN | NOT HISPANIC OR LATINO | ... | NaN | NaN | NaN | NaN | NaN | NaN | 2022-03-11 | NaN | NaN | 63113904 |
| 3 | 4 | AB12345 | AB12345-CHN-11-id-220 | id-220 | CHN-11 | 26 | YEARS | F | ASIAN | NOT HISPANIC OR LATINO | ... | NaN | NaN | NaN | NaN | NaN | NaN | 2022-03-26 | NaN | NaN | 63113904 |
| 4 | 5 | AB12345 | AB12345-CHN-7-id-267 | id-267 | CHN-7 | 40 | YEARS | M | ASIAN | NOT HISPANIC OR LATINO | ... | NaN | NaN | NaN | NaN | NaN | NaN | 2022-03-15 | NaN | NaN | 63113904 |
5 rows × 57 columns
# read into dataframe vs from package
my_file = hypehd.PACKAGEDIR / 'data' / 'vital_signs.csv'
vs=da.read("csv", my_file)
vs.head()
| USUBJID | PARAM | PARAMCD | AVAL | AVALU | ADTM | ADY | ATPTN | AVISIT | AVISITN | |
|---|---|---|---|---|---|---|---|---|---|---|
| 0 | AB12345-BRA-1-id-105 | Diastolic Blood Pressure | DIABP | 39.038337 | Pa | 2020/10/15 1:00 | 221 | 1 | SCREENING | -1 |
| 1 | AB12345-BRA-1-id-105 | Diastolic Blood Pressure | DIABP | 55.497804 | Pa | 2021/12/6 0:00 | 638 | 1 | BASELINE | 0 |
| 2 | AB12345-BRA-1-id-105 | Diastolic Blood Pressure | DIABP | 50.438759 | Pa | 2020/12/19 0:00 | 286 | 1 | WEEK 1 DAY 8 | 1 |
| 3 | AB12345-BRA-1-id-105 | Diastolic Blood Pressure | DIABP | 54.408067 | Pa | 2020/11/28 0:00 | 265 | 1 | WEEK 2 DAY 15 | 2 |
| 4 | AB12345-BRA-1-id-105 | Diastolic Blood Pressure | DIABP | 45.341591 | Pa | 2021/7/10 1:00 | 489 | 1 | WEEK 3 DAY 22 | 3 |
Filter the dataset
filter vs dataset to select only weight records and merge it with dm dataset usingdata_selection() function in data_manipulation
test = da.data_selection(keep_col=["USUBJID", "PARAMCD", "AVAL", "AVISITN"], sort_by=["SEX", "AGE"], sort_asc=True,
                         input_data=vs, cond='PARAMCD=="WEIGHT"', merge_data=dm, merge_by="USUBJID",
                         merge_keep_col=["USUBJID", "ITTFL", "SEX", "AGE", "TRT01P"])
test.head()
| USUBJID | PARAMCD | AVAL | AVISITN | ITTFL | SEX | AGE | TRT01P | |
|---|---|---|---|---|---|---|---|---|
| 1631 | AB12345-CHN-5-id-160 | WEIGHT | 48.578366 | -1 | Y | F | 21 | C: Combination |
| 1632 | AB12345-CHN-5-id-160 | WEIGHT | 46.529763 | 0 | Y | F | 21 | C: Combination |
| 1633 | AB12345-CHN-5-id-160 | WEIGHT | 55.107222 | 1 | Y | F | 21 | C: Combination |
| 1634 | AB12345-CHN-5-id-160 | WEIGHT | 51.847507 | 2 | Y | F | 21 | C: Combination |
| 1635 | AB12345-CHN-5-id-160 | WEIGHT | 53.882043 | 3 | Y | F | 21 | C: Combination |
Derive baseline info
using derive_baseline() function in data_manipulation calculate change from baseline, percent change from baseline of weight per each subject
test = da.derive_baseline(input_data=test, by_vars=["USUBJID", "PARAMCD"], value="AVAL", chg=True, pchg=True,
                          base_visit='AVISITN==0')
test.head()
| USUBJID | PARAMCD | AVAL | AVISITN | ITTFL | SEX | AGE | TRT01P | base | chg | pchg | |
|---|---|---|---|---|---|---|---|---|---|---|---|
| 0 | AB12345-CHN-5-id-160 | WEIGHT | 48.578366 | -1 | Y | F | 21 | C: Combination | 46.529763 | 2.048603 | 0.044028 |
| 1 | AB12345-CHN-5-id-160 | WEIGHT | 46.529763 | 0 | Y | F | 21 | C: Combination | 46.529763 | 0.000000 | 0.000000 |
| 2 | AB12345-CHN-5-id-160 | WEIGHT | 55.107222 | 1 | Y | F | 21 | C: Combination | 46.529763 | 8.577459 | 0.184343 |
| 3 | AB12345-CHN-5-id-160 | WEIGHT | 51.847507 | 2 | Y | F | 21 | C: Combination | 46.529763 | 5.317745 | 0.114287 |
| 4 | AB12345-CHN-5-id-160 | WEIGHT | 53.882043 | 3 | Y | F | 21 | C: Combination | 46.529763 | 7.352281 | 0.158012 |
Generate line plots for longitudinal data
using longitudinal_graph() function in visualization to generate plots of change from baseline, percent change from baseline by different visits
vis.longitudinal_graph(outcome=["chg", "pchg"], time="AVISITN", group="TRT01P", input_data=test)
([<Figure size 1500x900 with 1 Axes>, <Figure size 1500x900 with 1 Axes>],
 [<AxesSubplot:title={'center':'Line plot and summary table for Chg'}, ylabel='chg'>,
  <AxesSubplot:title={'center':'Line plot and summary table for Pchg'}, ylabel='pchg'>])


Derive extreme flags
using derive_extreme_flag() function to get the last and max records per each patient
df = da.derive_extreme_flag(input_data=vs, by_vars=['USUBJID', 'PARAMCD'], sort_var=['AVISITN'], new_var="last_flag", mode="last", value_var="AVAL")
df = da.derive_extreme_flag(input_data=df, by_vars=['USUBJID', 'PARAMCD'], sort_var=['AVISITN'], new_var="max_flag", mode="max", value_var="AVAL")
df.head(20)
| USUBJID | PARAM | PARAMCD | AVAL | AVALU | ADTM | ADY | ATPTN | AVISIT | AVISITN | last_flag | max_flag | |
|---|---|---|---|---|---|---|---|---|---|---|---|---|
| 0 | AB12345-BRA-1-id-105 | Diastolic Blood Pressure | DIABP | 39.038337 | Pa | 2020/10/15 1:00 | 221 | 1 | SCREENING | -1 | NaN | NaN |
| 1 | AB12345-BRA-1-id-105 | Diastolic Blood Pressure | DIABP | 55.497804 | Pa | 2021/12/6 0:00 | 638 | 1 | BASELINE | 0 | NaN | NaN |
| 2 | AB12345-BRA-1-id-105 | Diastolic Blood Pressure | DIABP | 50.438759 | Pa | 2020/12/19 0:00 | 286 | 1 | WEEK 1 DAY 8 | 1 | NaN | NaN |
| 3 | AB12345-BRA-1-id-105 | Diastolic Blood Pressure | DIABP | 54.408067 | Pa | 2020/11/28 0:00 | 265 | 1 | WEEK 2 DAY 15 | 2 | NaN | NaN |
| 4 | AB12345-BRA-1-id-105 | Diastolic Blood Pressure | DIABP | 45.341591 | Pa | 2021/7/10 1:00 | 489 | 1 | WEEK 3 DAY 22 | 3 | NaN | NaN |
| 5 | AB12345-BRA-1-id-105 | Diastolic Blood Pressure | DIABP | 50.297668 | Pa | 2022/2/4 0:00 | 698 | 1 | WEEK 4 DAY 29 | 4 | NaN | NaN |
| 6 | AB12345-BRA-1-id-105 | Diastolic Blood Pressure | DIABP | 59.269864 | Pa | 2020/7/5 1:00 | 119 | 1 | WEEK 5 DAY 36 | 5 | Y | Y |
| 7 | AB12345-BRA-1-id-105 | Pulse Rate | PULSE | 38.809968 | beats/min | 2021/12/31 0:00 | 663 | 1 | SCREENING | -1 | NaN | NaN |
| 8 | AB12345-BRA-1-id-105 | Pulse Rate | PULSE | 67.889859 | beats/min | 2021/9/9 1:00 | 550 | 1 | BASELINE | 0 | NaN | Y |
| 9 | AB12345-BRA-1-id-105 | Pulse Rate | PULSE | 45.968851 | beats/min | 2020/12/16 0:00 | 283 | 1 | WEEK 1 DAY 8 | 1 | NaN | NaN |
| 10 | AB12345-BRA-1-id-105 | Pulse Rate | PULSE | 54.551328 | beats/min | 2020/9/12 1:00 | 188 | 1 | WEEK 2 DAY 15 | 2 | NaN | NaN |
| 11 | AB12345-BRA-1-id-105 | Pulse Rate | PULSE | 51.229417 | beats/min | 2021/11/23 0:00 | 625 | 1 | WEEK 3 DAY 22 | 3 | NaN | NaN |
| 12 | AB12345-BRA-1-id-105 | Pulse Rate | PULSE | 43.133770 | beats/min | 2020/6/29 1:00 | 113 | 1 | WEEK 4 DAY 29 | 4 | NaN | NaN |
| 13 | AB12345-BRA-1-id-105 | Pulse Rate | PULSE | 58.700283 | beats/min | 2020/6/20 1:00 | 104 | 1 | WEEK 5 DAY 36 | 5 | Y | NaN |
| 14 | AB12345-BRA-1-id-105 | Respiratory Rate | RESP | 38.392288 | breaths/min | 2020/11/22 0:00 | 259 | 1 | SCREENING | -1 | NaN | NaN |
| 15 | AB12345-BRA-1-id-105 | Respiratory Rate | RESP | 51.254081 | breaths/min | 2021/6/14 1:00 | 463 | 1 | BASELINE | 0 | NaN | NaN |
| 16 | AB12345-BRA-1-id-105 | Respiratory Rate | RESP | 63.115384 | breaths/min | 2020/10/20 1:00 | 226 | 1 | WEEK 1 DAY 8 | 1 | NaN | Y |
| 17 | AB12345-BRA-1-id-105 | Respiratory Rate | RESP | 53.073852 | breaths/min | 2021/9/5 1:00 | 546 | 1 | WEEK 2 DAY 15 | 2 | NaN | NaN |
| 18 | AB12345-BRA-1-id-105 | Respiratory Rate | RESP | 34.650623 | breaths/min | 2020/11/4 0:00 | 241 | 1 | WEEK 3 DAY 22 | 3 | NaN | NaN |
| 19 | AB12345-BRA-1-id-105 | Respiratory Rate | RESP | 55.551606 | breaths/min | 2021/11/16 0:00 | 618 | 1 | WEEK 4 DAY 29 | 4 | NaN | NaN |
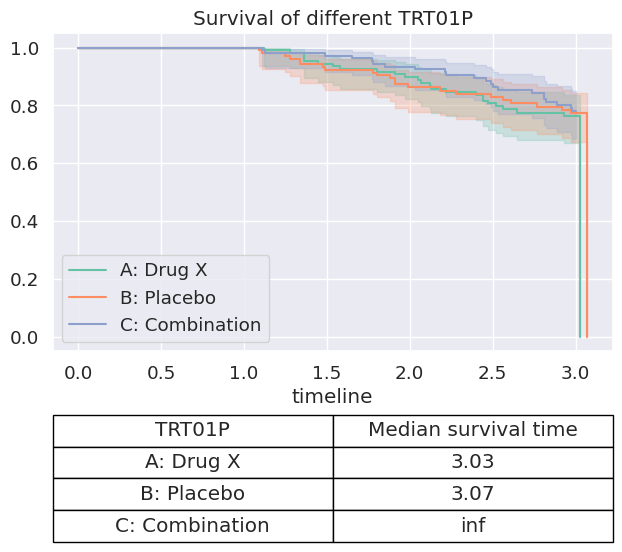
Survival analysis
using time_to_event() in data_manipulation to process the time to event variable and using survival_analysis() in visualization to generate the KM plot
dm2 = da.time_to_event(input_data=dm, start_date="TRTSDTM", end_date="DTHDT", censor_date="TRTEDTM",
                       new_var='time_to_death', unit='year')
dm2.head()
| Unnamed: 0 | STUDYID | USUBJID | SUBJID | SITEID | AGE | AGEU | SEX | RACE | ETHNIC | ... | DTHCAT | LDDTHELD | LDDTHGR1 | LSTALVDT | DTHADY | ADTHAUT | study_duration_secs | time_to_death | censor_status | unit | |
|---|---|---|---|---|---|---|---|---|---|---|---|---|---|---|---|---|---|---|---|---|---|
| 0 | 1 | AB12345 | AB12345-CHN-3-id-128 | id-128 | CHN-3 | 32 | YEARS | M | ASIAN | HISPANIC OR LATINO | ... | ADVERSE EVENT | 22.0 | <=30 | 2022-03-06 | 1106.0 | Yes | 63113904 | 3.03 | 1 | year |
| 1 | 2 | AB12345 | AB12345-CHN-15-id-262 | id-262 | CHN-15 | 35 | YEARS | M | BLACK OR AFRICAN AMERICAN | NOT HISPANIC OR LATINO | ... | NaN | NaN | NaN | 2022-03-17 | NaN | NaN | 63113904 | 3.00 | 0 | year |
| 2 | 3 | AB12345 | AB12345-RUS-3-id-378 | id-378 | RUS-3 | 30 | YEARS | F | ASIAN | NOT HISPANIC OR LATINO | ... | NaN | NaN | NaN | 2022-03-11 | NaN | NaN | 63113904 | 3.00 | 0 | year |
| 3 | 4 | AB12345 | AB12345-CHN-11-id-220 | id-220 | CHN-11 | 26 | YEARS | F | ASIAN | NOT HISPANIC OR LATINO | ... | NaN | NaN | NaN | 2022-03-26 | NaN | NaN | 63113904 | 3.00 | 0 | year |
| 4 | 5 | AB12345 | AB12345-CHN-7-id-267 | id-267 | CHN-7 | 40 | YEARS | M | ASIAN | NOT HISPANIC OR LATINO | ... | NaN | NaN | NaN | 2022-03-15 | NaN | NaN | 63113904 | 3.00 | 0 | year |
5 rows × 60 columns
vis.survival_analysis(time="time_to_death", censor_status="censor_status", group="TRT01P", input_data=dm2)
(<Figure size 800x600 with 1 Axes>,
 <AxesSubplot:title={'center':'Survival of different TRT01P'}, xlabel='timeline'>)